Text-Modelle verwalten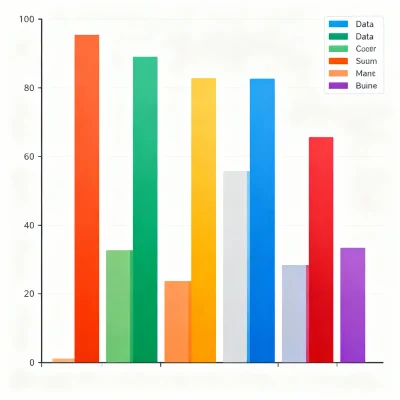


1,000 
Bonus beim ersten Kauf von $100 oder mehr
 Automatisch (Eingabesprache)
 English (United States)
 Spanish (Spain)
 French (France)
 German (Germany)
 Italian (Italy)
 Portuguese (Brazil)
 Arabic (Generic)
 Bengali (India)
 Bulgarian (Bulgaria)
 Croatian (Croatia)
 Czech (Czech Republic)
 Danish (Denmark)
 Dutch (Belgium)
 Dutch (Netherlands)
 Estonian (Estonia)
 Finnish (Finland)
 Greek (Greece)
Gujarati (India)
Greek (Greece)
Gujarati (India)
 Hebrew (Israel)
Hindi (India)
Hebrew (Israel)
Hindi (India)
 Hungarian (Hungary)
 Indonesian (Indonesia)
 Japanese (Japan)
Kannada (India)
Japanese (Japan)
Kannada (India)
 Korean (South Korea)
 Latvian (Latvia)
 Lithuanian (Lithuania)
Malayalam (India)
Lithuanian (Lithuania)
Malayalam (India)
 Mandarin Chinese (China)
Marathi (India)
Mandarin Chinese (China)
Marathi (India)
 Norwegian Bokmål (Norway)
 Polish (Poland)
 Romanian (Romania)
 Russian (Russia)
 Serbian (Cyrillic)
 Slovak (Slovakia)
 Slovenian (Slovenia)
 Swahili (Kenya)
 Swedish (Sweden)
Tamil (India)
Telugu (India)
Swedish (Sweden)
Tamil (India)
Telugu (India)
 Thai (Thailand)
 Turkish (Turkey)
 Ukrainian (Ukraine)
 Urdu (India)
 Vietnamese (Vietnam)

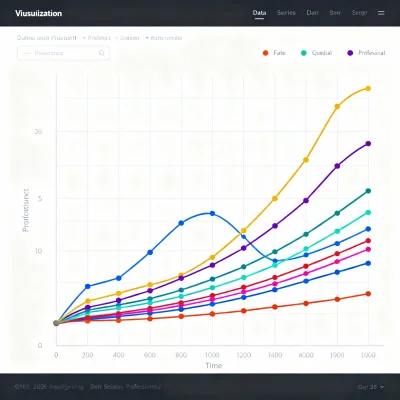
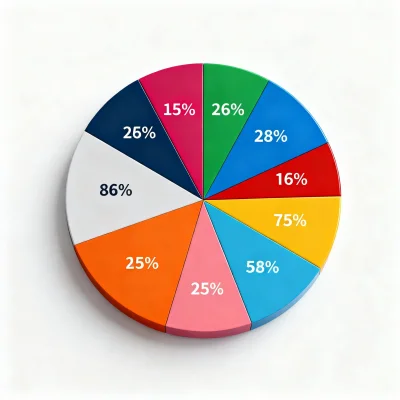
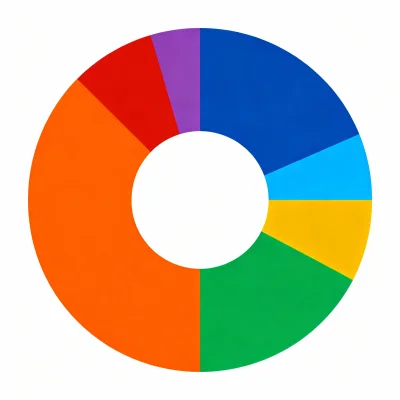
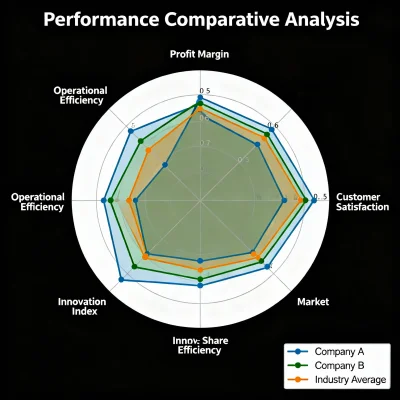
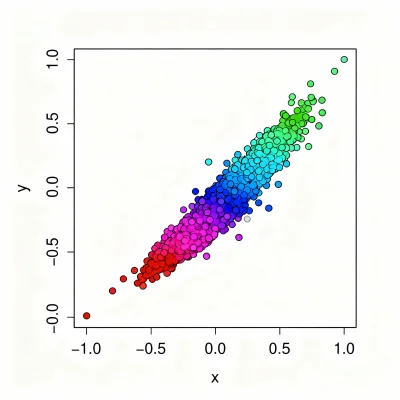
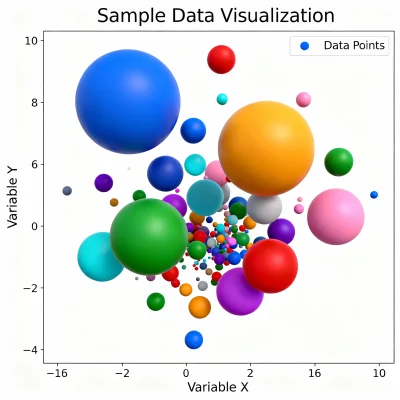
Generate beautiful, interactive charts from text descriptions. Describe your data and let AI create bar charts, line graphs, pie charts, and more using Chart.js.
Business presentations needing quick data visualization, students creating reports with charts, marketers displaying campaign metrics, educators illustrating concepts, researchers presenting findings, and anyone needing to turn data descriptions into visual charts.
Multiple chart types including bar, line, pie, doughnut, radar, and more. Customizable color themes, interactive Chart.js rendering, AI-generated realistic sample data, and export options for presentations.

Bonus beim ersten Kauf von $100 oder mehr

Bonus beim ersten Kauf von $10 oder mehr